SAC-SINGLAS Accredited
Acc. No.
LA-2023-0845-C
Every ISO/IEC 17025 calibration certificate must include a statement of measurement uncertainty. This uncertainty is not a guess or a safety margin. It is the result of a formal calculation called an uncertainty budget, which identifies every source of error in the calibration process, quantifies each one, and combines them using established statistical methods. For quality engineers, quality managers, and anyone who uses calibration certificates in an ISO 9001 or GMP context, understanding what an uncertainty budget is (and what the uncertainty number on the certificate means), is essential.
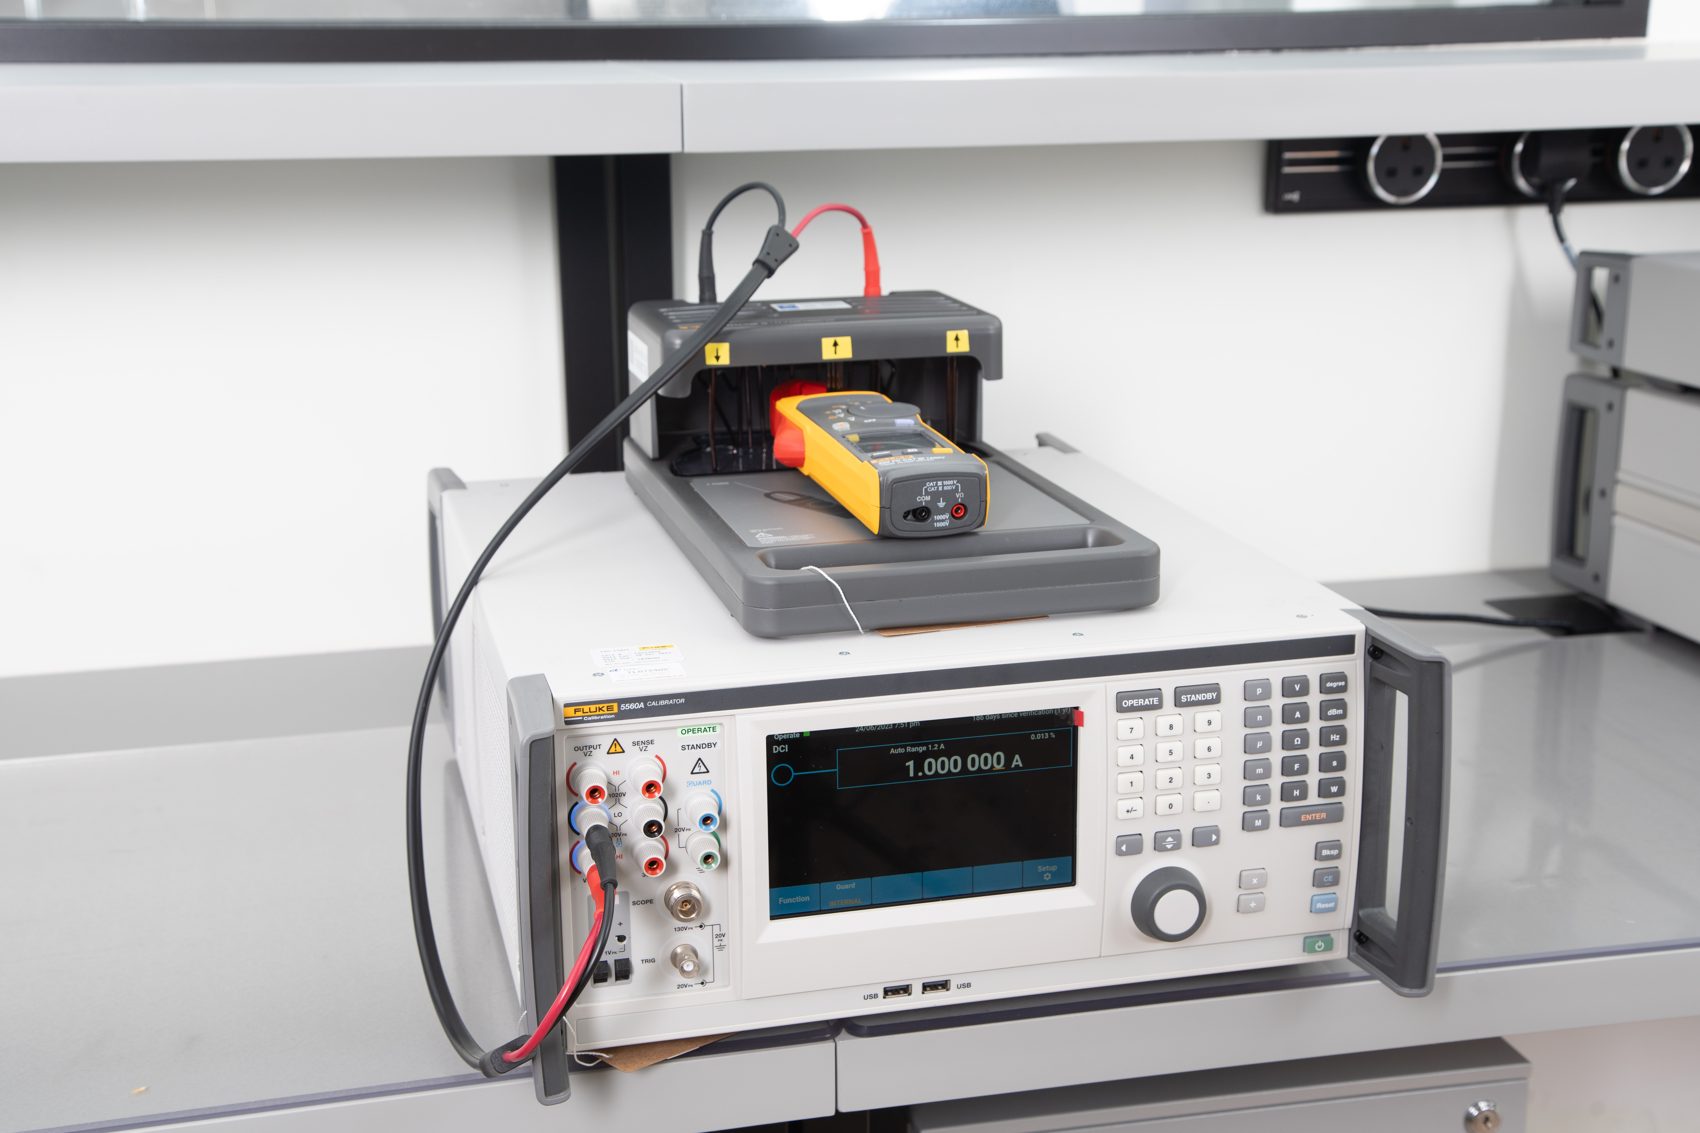
ISO/IEC 17025:2017 is the international standard for the competence of testing and calibration laboratories. Clause 7.6 of the standard requires calibration laboratories to identify all contributions to measurement uncertainty and to calculate the combined standard uncertainty for every calibration result they report. This is not optional, and it is not left to the discretion of the laboratory. A calibration certificate that does not state a measurement uncertainty is, by definition, non-compliant with ISO/IEC 17025:2017. Regardless of any other claims printed on the document, regardless of how long the laboratory has been operating, and regardless of whether the laboratory holds any other certifications.
This requirement exists because a calibration result without an uncertainty statement is, in practical terms, incomplete. When a calibration laboratory measures your instrument against a reference standard and reports that your thermometer reads 0.05°C high at 100°C, that number alone tells you nothing meaningful about whether your instrument is acceptable. The question that matters is: how confident can you be in that 0.05°C figure? Could the true error actually be 0.12°C? Could it be 0.00°C? Without knowing the uncertainty of the calibration process itself, you have no way to answer these questions.
Consider a concrete example. Suppose your instrument has a tolerance of ±0.1°C. Meaning you require the instrument to read within 0.1°C of the true value to meet your process or product specification. If the calibration laboratory's expanded uncertainty for that measurement is ±0.15°C, the calibration cannot reliably tell you whether your instrument is in tolerance or out of tolerance. The uncertainty exceeds the tolerance. A calibration result showing an error of +0.07°C would appear to be within the ±0.1°C tolerance, but when the uncertainty of ±0.15°C is accounted for, the true error could be anywhere from −0.08°C to +0.22°C. The instrument could be well out of tolerance, and the calibration is incapable of detecting it.
Conversely, if the calibration laboratory's expanded uncertainty is ±0.02°C, then a measured error of +0.07°C is much more meaningful. The true error lies between +0.05°C and +0.09°C with approximately 95% confidence. The instrument is clearly within tolerance, and the calibration result can be relied upon for conformity decisions.
This is precisely why regulatory bodies, auditors, and quality standards that require "calibrated" instruments also generally require those instruments to be calibrated by an ISO/IEC 17025 accredited laboratory. Accreditation is the mechanism by which the uncertainty statement is independently assessed and confirmed. An accredited laboratory's scope of accreditation (its Calibration and Measurement Capabilities (CMC)), represents the best uncertainty it can achieve for each measurement quantity and range, and those figures are verified by the accreditation body through regular audits and proficiency testing.
Every calibration involves multiple sources of uncertainty. Identifying and quantifying all of them is the first and most important step in building an uncertainty budget. To make this concrete, we will use a temperature calibration as the worked example throughout this article. Specifically, the calibration of a digital thermometer at 100°C using a reference platinum resistance thermometer (PRT) in a calibration bath.
The calibration laboratory's reference thermometer was itself calibrated at a higher-level laboratory, in Singapore's case, traceable back to the National Metrology Centre (NMC) at A*STAR. The calibration certificate for the reference PRT states an expanded uncertainty of U_ref = 0.04°C at k=2. To use this in the budget, we convert it to a standard uncertainty by dividing by the coverage factor: u_ref = 0.04 / 2 = 0.02°C. This is a Type B contribution. It is evaluated from information on the calibration certificate, not from repeated measurements in this calibration.
If the thermometer being calibrated displays temperature to the nearest 0.1°C, the last digit introduces a rounding uncertainty. The reading could be anywhere within ±0.05°C of the true value before the display rounds to the nearest 0.1°C. We model this as a rectangular distribution (the error is equally likely anywhere in the range), so the standard uncertainty is: u_res = 0.05 / √3 = 0.029°C. This is a Type B contribution.
The calibration technician takes 10 repeated readings at 100°C with the instrument held stationary in stable conditions. The standard deviation of these 10 readings is calculated to be 0.03°C. The standard uncertainty contribution from repeatability is the standard deviation of the mean: u_rep = 0.03 / √10 = 0.0095°C. This is a Type A contribution. It is evaluated directly from statistical analysis of the measurement data collected during this calibration.
The calibration bath used to maintain the 100°C reference temperature is not perfectly uniform throughout its volume. The laboratory has characterised the spatial temperature uniformity of the bath and found it to be within ±0.02°C across the zone where instruments are placed. We model this as a rectangular distribution: u_env = 0.02 / √3 = 0.0115°C. This is a Type B contribution, evaluated from the laboratory's bath characterisation measurements rather than from direct readings during this calibration.
The reference PRT was calibrated 12 months ago. Based on historical data and manufacturer specifications, the drift of this type of reference thermometer between annual calibrations is estimated to be no more than ±0.01°C. We model this as a rectangular distribution (we have no reason to think drift is more likely in one direction than the other): u_drift = 0.01 / √3 = 0.0058°C. This is a Type B contribution.
In practice, a laboratory's uncertainty budget may contain additional sources depending on the measurement and equipment, for example, the self-heating of the reference thermometer's sensing element, the thermal conductivity between the bath fluid and the thermometer stem, the calibration of the data acquisition system reading the PRT's resistance, and the stability of the reference bath's temperature controller. The five sources above are the most common and usually the most significant contributions.
The Guide to the Expression of Uncertainty in Measurement (universally known as the GUM), is the authoritative international document governing how measurement uncertainty must be evaluated and reported. It is a joint publication of eight international scientific and standards bodies: BIPM (the International Bureau of Weights and Measures), IEC, IFCC, ILAC, ISO, IUPAC, IUPAP, and OIML. The GUM is freely available from the BIPM website and has been adopted as the normative methodology by all major calibration standards, including ISO/IEC 17025.
The GUM's central contribution was to establish a unified, internationally consistent framework for uncertainty evaluation. Before the GUM was published in 1993, different laboratories and different sectors used different methods. Some based purely on worst-case (arithmetic addition of all contributions), some based on purely statistical approaches, and many using undocumented internal practices. The result was that uncertainty statements from different laboratories could not be meaningfully compared. The GUM resolved this by specifying exactly how uncertainty sources should be identified, classified, evaluated, and combined.
The GUM classifies uncertainty evaluation methods into two types. This classification is often misunderstood. It is about how the uncertainty is evaluated, not about whether it is reliable or important.
Type A evaluation uses statistical methods applied to repeated measurements. If a technician takes n repeated measurements and computes their standard deviation s, the Type A standard uncertainty of the mean is u_A = s / √n. The reliability of a Type A evaluation improves with the number of measurements. With only 5 measurements, the degrees of freedom are low and the statistical estimate of the standard deviation is itself uncertain. With 30 measurements, the estimate is much more reliable.
Type B evaluation uses all other means. This includes information from calibration certificates (for reference standards), manufacturer specifications (for instruments), published data (for physical properties such as thermal expansion coefficients), judgement based on experience, and laboratory characterisation studies. A Type B contribution is not less reliable than a Type A contribution merely because it does not come from statistics. A Type B contribution from a calibration certificate issued by a National Metrology Institute (NMI) (backed by primary measurement standards and multiple independent measurements), may be far more reliably characterised than a Type A contribution based on three readings by a single technician on a single day.
The GUM also specifies how to assign probability distributions to uncertainty sources. When a quantity is equally likely to be anywhere within a stated range (e.g. a digital resolution of ±0.05°C, or a drift bound of ±0.01°C), a rectangular distribution is appropriate, and the standard uncertainty is the half-width divided by √3. When the source follows the familiar bell-curve shape (e.g. repeatability evaluated from many measurements), a normal distribution is appropriate. When a certificate states that the stated uncertainty has been evaluated at 95% confidence with k=2, the standard uncertainty is simply the expanded uncertainty divided by 2.
Once each uncertainty source has been evaluated and expressed as a standard uncertainty (with units consistent with the measurement), the components are combined using the root-sum-of-squares (RSS) method, also called quadrature addition. This method is valid when the uncertainty sources are independent of each other. Meaning knowledge of the size of one contribution gives no information about the size of another. In most calibrations, this independence assumption is satisfied.
The combined standard uncertainty u_c is calculated as:
u_c = √(u₁² + u₂² + u₃² + u₄² + u₅²)
Using the five temperature calibration contributions from above:
u_c = √(0.02² + 0.029² + 0.0095² + 0.0115² + 0.0058²)
Expanding each squared term:
Sum of squares = 0.000400 + 0.000841 + 0.0000903 + 0.0001323 + 0.0000336 = 0.001497
u_c = √0.001497 = 0.0387°C
The combined standard uncertainty represents one standard deviation of the overall measurement process, approximately 68% confidence. To produce the expanded uncertainty reported on the certificate, we multiply by the coverage factor. At k=2:
U = 2 × 0.0387 = 0.077°C ≈ 0.08°C
Following GUM guidance, the expanded uncertainty is rounded to two significant figures. The calibration certificate therefore states: "Expanded uncertainty U = ±0.08°C at k=2 (approximately 95% confidence level)."
The worked example table below summarises all five contributions and the RSS combination:
| Source | Type | Distribution | Standard Uncertainty u (°C) | u² (°C²) |
|---|---|---|---|---|
| Reference standard uncertainty (U_ref = 0.04°C, k=2) | B | Normal | 0.0200 | 0.000400 |
| Resolution of instrument under calibration (±0.05°C) | B | Rectangular | 0.0289 | 0.000841 (approx. 0.000836) |
| Repeatability of readings (s = 0.03°C, n=10) | A | Normal | 0.0095 | 0.0000903 |
| Environmental effects, bath uniformity (±0.02°C) | B | Rectangular | 0.0115 | 0.0001323 |
| Reference standard drift (±0.01°C over 12 months) | B | Rectangular | 0.0058 | 0.0000336 |
| Combined standard uncertainty u_c | , | RSS | 0.0387°C | 0.001497 |
| Expanded uncertainty U (k=2, ~95%) | , | , | ±0.08°C | |
Our accreditation schedule lists our Calibration and Measurement Capabilities (CMC). The best uncertainty we can achieve for each measurement quantity and range.
The expanded uncertainty statement on a calibration certificate contains three critical pieces of information: the uncertainty value, the units, and the coverage factor. The statement "U = ±0.08°C at k=2" means: the expanded uncertainty of the calibration result is 0.08°C, based on a coverage factor of 2, which for a normal distribution corresponds to a confidence level of approximately 95%. If the calibration were repeated under the same conditions many times, the interval defined by the measured value ± U would contain the true value approximately 95% of the time.
The coverage factor k is essential to interpreting the uncertainty value. k=2 corresponds to approximately 95.45% confidence for a normal (Gaussian) probability distribution. k=3 corresponds to approximately 99.73% confidence. ISO/IEC 17025 and GUM guidance both recommend k=2 as the standard coverage factor for calibration certificates, because it provides a clear and consistent meaning across all certificates from all accredited laboratories worldwide. When you receive a certificate from any ISO/IEC 17025-accredited laboratory that states k=2, you know the confidence level without having to ask.
If a certificate does not state the coverage factor, you cannot determine the confidence level, and you cannot compare the uncertainty with certificates from other laboratories. A certificate stating "uncertainty = ±0.08°C" without stating k is incomplete, even if the laboratory appears to be ISO/IEC 17025-accredited. A properly issued certificate always includes the coverage factor and the confidence level.
The practical implication of the uncertainty statement becomes clear when you apply it to a conformity decision. Suppose your thermometer's calibration result shows a measured error of +0.05°C, and the expanded uncertainty is ±0.08°C. The calibration result tells you that the true error lies approximately between +0.05°C − 0.08°C = −0.03°C and +0.05°C + 0.08°C = +0.13°C, with approximately 95% confidence. Now suppose your instrument specification requires the error to be within ±0.1°C. The upper end of this uncertainty interval (+0.13°C) exceeds the tolerance. The instrument may be in tolerance or it may not be. The calibration cannot definitively confirm conformity.
This situation is not a failure of the calibration. It is a signal that either the tolerance is very tight for this type of calibration, or a different calibration laboratory with a smaller uncertainty should be used, or the conformity decision needs to incorporate the uncertainty formally through guard banding, which is covered in the next section.
The relationship between your instrument's tolerance and the calibration uncertainty is formalised in a concept called the Test Uncertainty Ratio, or TUR. It is also sometimes called the tolerance-to-uncertainty ratio:
TUR = Tolerance / Expanded Uncertainty = T / U
The TUR tells you how many times the expanded uncertainty fits inside the tolerance. A higher TUR means the calibration is more capable relative to the tolerance, and conformity decisions can be made with greater confidence.
Industry guidance (most notably from ILAC, ANSI Z540.3, and the JCGM metrology vocabulary), provides the following practical benchmarks:
In the temperature example above: if the tolerance is ±0.5°C and the uncertainty is ±0.08°C, the TUR = 0.5 / 0.08 = 6.25:1 (excellent. If the tolerance is ±0.1°C and the uncertainty is ±0.08°C, the TUR = 0.1 / 0.08 = 1.25:1), this calibration cannot meaningfully support conformity decisions at this tolerance.
The practical implication for anyone managing calibration is this: before you send an instrument to a calibration laboratory, check the laboratory's accreditation schedule (specifically its Calibration and Measurement Capabilities (CMC)), and verify that the CMC uncertainty for your measurement quantity and range produces a TUR of at least 4:1 against your instrument's tolerance. If it does not, you need to either find a laboratory with a smaller uncertainty, widen your tolerance (where technically permissible), or apply guard banding explicitly in your quality system.
This check is one of the most important steps in managing a calibration programme, yet it is often overlooked. Many organisations simply send instruments to the nearest accredited laboratory without verifying that the laboratory's capability is adequate for their specifications. The uncertainty statement on the certificate is the mechanism that enables this check, which is yet another reason why the ISO/IEC 17025 requirement for stated uncertainty exists and matters in practice.
Guard banding is the formal approach to handling cases where the TUR is low. Rather than accepting an instrument if its measured error falls anywhere within the full tolerance band, the acceptance zone is reduced by the expanded uncertainty on each side. For example, with a ±0.1°C tolerance and a ±0.08°C uncertainty, a guard-banded acceptance zone would be approximately ±0.02°C. Only instruments measured to be within 0.02°C of zero error would be accepted. This conservative approach ensures that, even accounting for the calibration uncertainty, there is a high probability that accepted instruments truly conform to the specification. ILAC G8:09/2019 provides detailed guidance on guard banding for calibration laboratories and their customers.
A calibration uncertainty budget is a formal document or calculation that identifies every source of measurement uncertainty in a calibration, quantifies each source, and combines them to produce the overall expanded uncertainty reported on the calibration certificate. The budget lists each contribution (e.g. reference standard uncertainty, instrument resolution, repeatability, environmental effects, and reference drift), states its type (Type A from statistics, Type B from other means), assigns it a probability distribution, converts it to a standard uncertainty, and then combines all contributions using the root-sum-of-squares (RSS) method. The result is multiplied by a coverage factor (typically k=2) to give the expanded uncertainty at approximately 95% confidence.
ISO/IEC 17025:2017 clause 7.6 requires calibration laboratories to identify uncertainty contributions and calculate the combined standard uncertainty for every calibration result. A certificate without a stated uncertainty is not compliant with ISO/IEC 17025:2017. From a practical standpoint, the uncertainty tells you the minimum tolerance for which the calibration is meaningful. Without it, you cannot determine whether the calibration is adequate for your application, for example, whether the lab's capability is sufficient to verify an instrument with a tight specification.
Standard uncertainty (u) is the one-sigma (one standard deviation) measure of uncertainty. It represents approximately 68% confidence that the true value falls within the stated range. Expanded uncertainty (U) is the standard uncertainty multiplied by a coverage factor k: U = k × u. At k=2, the expanded uncertainty represents approximately 95% confidence (for a normal distribution). At k=3, approximately 99.7%. Calibration certificates report expanded uncertainty, not standard uncertainty, because expanded uncertainty gives a more practically useful confidence interval. The standard uncertainty is used in the calculation (RSS combination), while the expanded uncertainty is the final reported value.
The coverage factor k=2 means the reported expanded uncertainty U = 2 × u_c (where u_c is the combined standard uncertainty). For a normal (Gaussian) probability distribution, k=2 corresponds to a confidence level of approximately 95.45%. Meaning the true measurement error lies within the stated uncertainty interval with approximately 95% probability. ISO/IEC 17025 and GUM guidance recommend reporting uncertainty at k=2 as the standard practice, so that calibration certificates from different laboratories can be compared on a consistent basis. When k is not stated on a certificate, you cannot determine the confidence level and cannot compare it with other certificates.
The main sources depend on the measurement quantity, but for a typical temperature calibration they include: (1) the uncertainty of the reference standard itself (from its own calibration certificate, a Type B contribution); (2) the resolution of the instrument under calibration (Type B, rectangular distribution); (3) repeatability of readings (Type A, evaluated from repeated measurements); (4) environmental effects such as temperature bath uniformity or ambient temperature variation (Type B); and (5) drift of the reference standard between its calibration dates (Type B). These contributions are combined using root-sum-of-squares. In electrical calibrations, additional sources include contact resistance, loading effects, and electromagnetic interference. In pressure calibrations, head corrections, temperature effects on the reference fluid, and barometric pressure variation are typical contributions.
When a calibration laboratory makes a conformity decision (pass/fail), it must apply a decision rule that accounts for uncertainty. Without guard banding (simple acceptance), an instrument passes if the measured error is within the tolerance, regardless of uncertainty. With guard banding (the approach recommended by ILAC G8), the acceptance zone is narrowed by the expanded uncertainty, so an instrument with a measured error close to the tolerance limit may fail even if the raw reading is technically within tolerance. The uncertainty value on your certificate directly determines how close the acceptance zone is to the tolerance edge. A smaller uncertainty means a more meaningful calibration and a larger effective acceptance zone relative to the tolerance.
The GUM (Guide to the Expression of Uncertainty in Measurement) is a joint publication by BIPM, IEC, IFCC, ILAC, ISO, IUPAC, IUPAP, and OIML. It defines the internationally agreed methodology for evaluating and expressing measurement uncertainty. It introduced the classification of uncertainty sources into Type A (statistical) and Type B (non-statistical), the RSS method for combining standard uncertainties, and the expanded uncertainty with stated coverage factor. All ISO/IEC 17025-accredited calibration laboratories are required to use GUM-consistent methodology for their uncertainty budgets. The GUM is freely available from the BIPM website and is the foundation of all modern calibration uncertainty practice.

This article was reviewed by the Unitest technical team. Unitest Instruments holds SAC-SINGLAS accreditation LA-2023-0845-C under ISO/IEC 17025:2017. Our uncertainty budgets follow GUM-consistent methodology across all calibration quantities.
Every Unitest certificate includes a GUM-consistent uncertainty statement. View our accreditation schedule to see our Calibration and Measurement Capabilities (CMC) for your instrument type.